
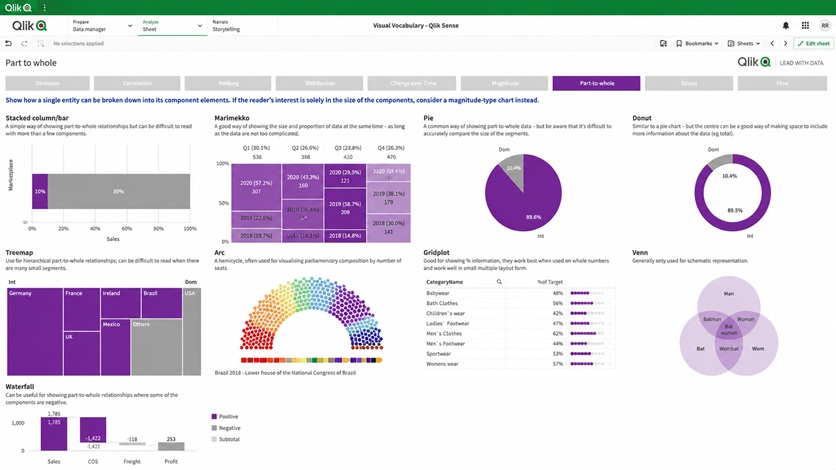
Move beyond static reports with interactive dashboards that transform complex data into clear, actionable narratives. Powered by the Associative Engine, every visualization is fully connected, allowing you to explore data in any direction and instantly uncover hidden patterns across all your datasets. This deep level of interactivity ensures no insight is missed, driving faster and more accurate decision-making across the enterprise


Interactive and Associative Exploration
- Associative Engine: Explore all data, in any direction, without being limited by pre-defined queries
- Instant Recalculation: Filter and interact with the data with every visualization updating in real-time
- The Power of Gray: Easily identify what data is excluded from your selections to find hidden gaps or opportunities
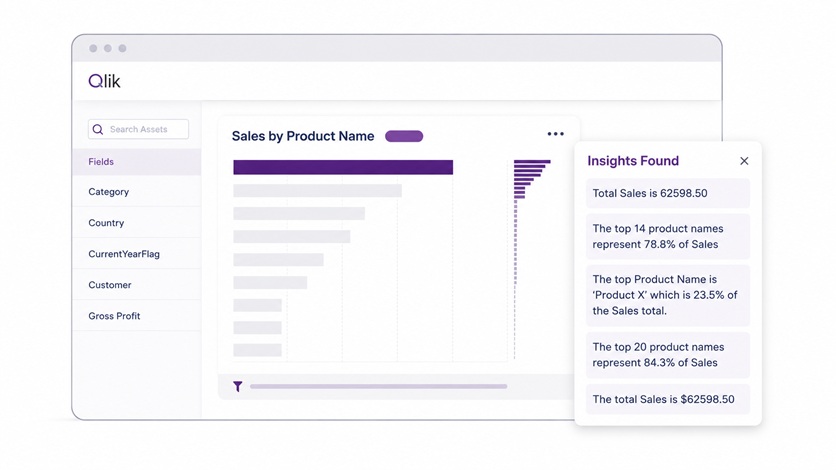
AI-Powered Augmented Analytics
- Insight Advisor: Use natural language to generate charts and get answers to complex business questions
- Automated Suggestions: Receive AI-driven recommendations for the most effective ways to visualize your specific datasets
- Advanced Calculations: Access complex statistical functions and predictive insights without requiring data science background
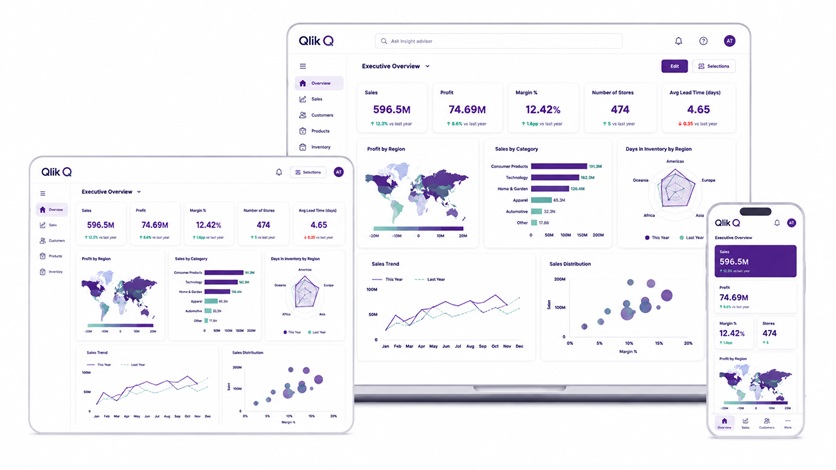
Flexible and Responsive Design
- Responsive Layouts: Create once and deploy everywhere with dashboards that adapt to any screen size
- Drag-and-Drop Authoring: Easily build professional-grade visualizations with an intuitive, governed interface
- Governed Self-Service: Enable users to create their own insights within a secure, managed framework
Ready to get more from your data?
How Organizations Drive Results with Qlik
Retail & Inventory Management

Retail & Inventory Management
Financial Services (Performance Tracking)
Financial Services (Performance Tracking)
Healthcare Operations
Healthcare Operations
Ready to make smarter decisions with your data?
Let’s talk. Leave your details below
FAQs
Standard dashboards rely on linear, SQL-based queries that only show what you asked for. Filtering for a specific region means you lose sight of the rest. Qlik’s Associative Engine keeps all the data in memory, showing the data related to your selection in white, and what is unrelated in gray. This allows for a much deeper and more intuitive exploration of the “why” behind the data.
Yes. Qlik’s dashboards are built using a web-first, API-rich architecture. Using Qlik Embedded Analytics you can take any single chart or entire dashboard and seamlessly embed it into your existing applications or portals. This maintains users i interactivity and security.
Not at all. Qlik is designed for “governed self-service.” While IT ensures the data is clean and secure, business users can use simple drag-and-drop tools and AI-driven suggestions (Insight Advisor) to build their own visualizations. This democratizes data access while maintaining a single source of the truth across the organization.